
A KPI tree connects 1 company goal to the numbers that explain or influence it, branch by branch, until the numbers at the bottom are ones a single team can watch and act on in a reasonable time. In this framework, each link is labelled either a formula, such as revenue equals orders times average order value, or an influence to test, such as faster onboarding leading to fewer customers lost, and every number has 1 accountable owner.
You should not cascade a company target by copying it into each department with a smaller number. A sales team handed "10% of the growth target" knows its share, not what to change on Monday.
What is a KPI tree?
A KPI tree, often also called a metric tree or a driver tree, is a diagram that links a top-level goal to the measures underneath it. Mixpanel describes it as "a hierarchical model that links your North Star metric to the inputs that influence it" (Mixpanel).
Breaking a result into its parts is older than software. At DuPont, the assistant treasurer Donaldson Brown developed a formula in 1914 that combined earnings, working capital and investment in plant into a single measure of return on investment (Hagley Museum and Library). It is an early example of the same way of thinking, not the origin of today's KPI trees.
Why do teams need a KPI tree?
Teams struggle to hit a target they cannot connect to their own work. In Gallup's surveys of US workers in the first half of 2026, with 43,262 responses, 49% strongly agreed that they know what is expected of them at work, well below the 61% peak in 2015 (Gallup, July 2026). The survey does not test KPI trees. It shows how common the gap is, and a KPI tree is 1 way to close it: this is the result the company needs, and this is the part your team moves.
A tree is especially useful when 2 teams can improve their own numbers without improving the company result. Sales sends quotes faster while fewer of them become orders. The warehouse cuts the cost per order while delivery errors rise. Drawn as a tree, those tensions are visible, so leaders can talk about the trade-off instead of rewarding each local number on its own.
Both examples below are hypothetical. The company sizes, thresholds and review periods are illustrations, not industry benchmarks; replace them with your own definitions and targets.
KPI tree example 1: operating profit in a distribution company
A formula-led tree can reconcile a financial result when its branches are complete and consistently defined. This example is for a distribution company of about 200 people.
| ID | Parent | Number | How it links to the parent | Owner |
|---|---|---|---|---|
| 1 | Operating profit | Goal: revenue minus cost of goods sold minus operating expenses | CEO | |
| 1.1 | 1 | Revenue | Formula: adds | Sales lead |
| 1.2 | 1 | Cost of goods sold | Formula: subtracts | Purchasing lead |
| 1.3 | 1 | Operating expenses | Formula: subtracts | Finance lead |
| 1.1.1 | 1.1 | Orders per month | Revenue = orders × average order value | Sales lead |
| 1.1.2 | 1.1 | Average order value | Key account lead | |
| 1.3.1 | 1.3 | Fulfilment cost | Orders delivered × variable cost per order + fixed fulfilment costs | Warehouse lead |
| 1.1.1.1 | 1.1.1 | % of quote requests answered within 24 hours | Influence: should lift orders | Inside sales lead |
| 1.3.1.1 | 1.3.1 | % of orders picked in a single pass | Influence: should lower cost per order | Warehouse lead |
| 1.3.1.2 | 1.3.1 | % of deliveries needing a second trip | Influence: raises cost per order | Transport lead |
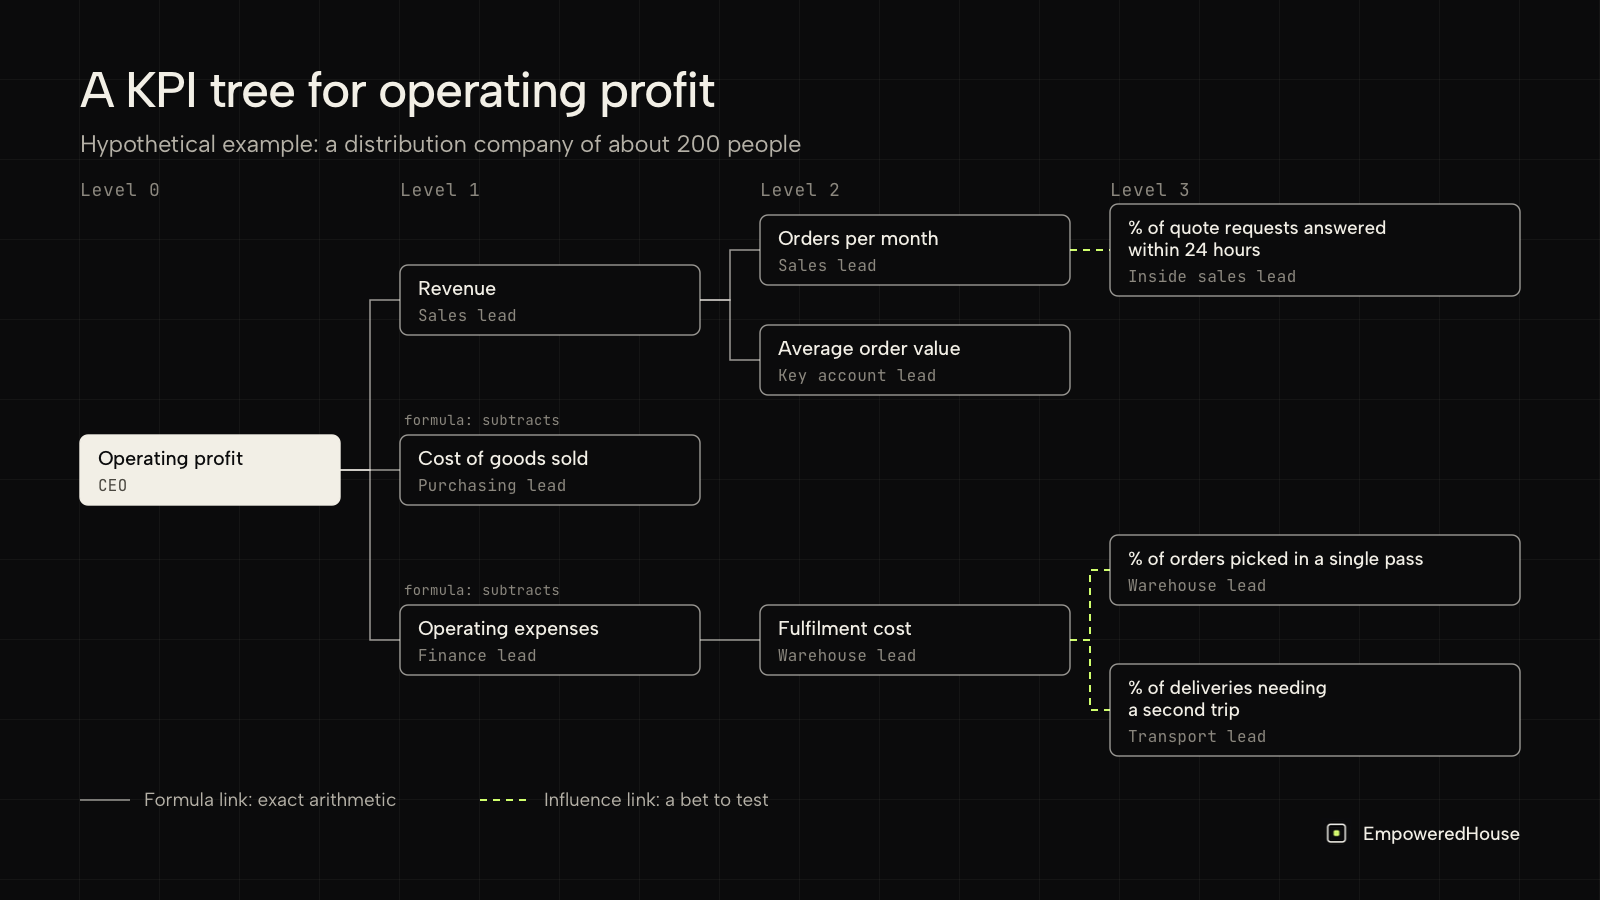
Gross profit is revenue minus cost of goods sold; gross margin is the same thing as a percentage of revenue. Fulfilment cost is only 1 part of operating expenses: the other parts, such as office and sales costs, sit in their own branches, and none of them may count the cost of goods a second time. This example counts fulfilment in operating expenses; some companies book part of it in cost of goods sold, so state your convention and count each cost once.
Worked example (illustrative): a distributor records €2.0m in monthly revenue (5,000 orders × €400 average order value), €1.35m in cost of goods sold and €500k in operating expenses, so operating profit is €150k. Fulfilment is 5,000 delivered orders × €28 variable cost plus €40k fixed cost, €180k; the other €320k sits in other operating expense branches.
The formula levels are arithmetic: if a number below changes, the number above changes by a known amount. The bottom level is where the formula ends and the bet begins. Each bet needs a guardrail: watch the share of quotes that become orders next to quote speed, and picking errors next to the cost per order.
KPI tree example 2: revenue retention in a software company
When the result has a formula at the top and only hypotheses below it, the tree mixes both. This example is for a company of about 100 people that sells yearly subscriptions.
| ID | Parent | Number | How it links to the parent | Owner |
|---|---|---|---|---|
| 1 | Annual recurring revenue (ARR) today from customers who were active 12 months ago | Goal: their ARR 12 months ago + expansion − contraction − churned ARR | CEO | |
| 1.1 | 1 | Churned ARR | Formula: subtracts | Customer success lead |
| 1.2 | 1 | Contraction ARR | Formula: subtracts | Customer success lead |
| 1.3 | 1 | Expansion ARR | Formula: adds | Account management lead |
| 1.4 | 1 | ARR of the same customers 12 months ago | Formula: the starting point | Finance lead |
| 1.1.1 | 1.1 | % of these customers who finished onboarding within 30 days of starting | Influence: should lower churn | Onboarding lead |
| 1.1.2 | 1.1 | % of open support tickets older than 5 days | Influence: raises churn and contraction | Support lead |
| 1.3.1 | 1.3 | % of customers with a review meeting in the last quarter | Influence: should lift expansion | Account management lead |
Dividing the goal by the same customers' ARR 12 months earlier gives net revenue retention. Revenue from customers won during the year stays out, or the number stops measuring retention. For the same reason, every number below the goal describes the same customers: onboarding of customers won this quarter belongs in next year's tree, not this one.
Worked example (illustrative): a software company starts the year with €1.2m in ARR from its existing customers. Over 12 months, those customers add €160k in expansion, lose €50k in contraction and €90k in churn. Their ARR at the end is €1.22m, so net revenue retention is €1.22m / €1.2m = 101.7%.
The bottom numbers are candidate leading indicators. Each is a plausible early signal, and each link to churn or expansion has to be tested, not assumed.
KPI tree template
Copy the table into a spreadsheet, start from your own goal, and fill 1 row per number. Metric ID and Parent ID build the tree; the other columns make each number checkable. The first 2 rows show example 1.
| Metric ID | Parent ID | Number and definition | Link type | Operator or expected direction | Unit and period | Data source | Accountable owner | Review rhythm | Threshold and action | Evidence status |
|---|---|---|---|---|---|---|---|---|---|---|
| 1 | Operating profit | Goal | € per month | Finance ledger | CEO | Monthly | Below plan 2 months in a row: review all branches | |||
| 1.1 | 1 | Net revenue recognised in the month | Formula | Adds | € per month | Finance ledger | Sales lead | Monthly | Exact | |
For formula branches, check that the numbers below add up to the number above before using the tree in a management review. For influence branches, the evidence status says whether the link is still a hypothesis or has held up in your data.
How do you build a KPI tree in 5 steps?
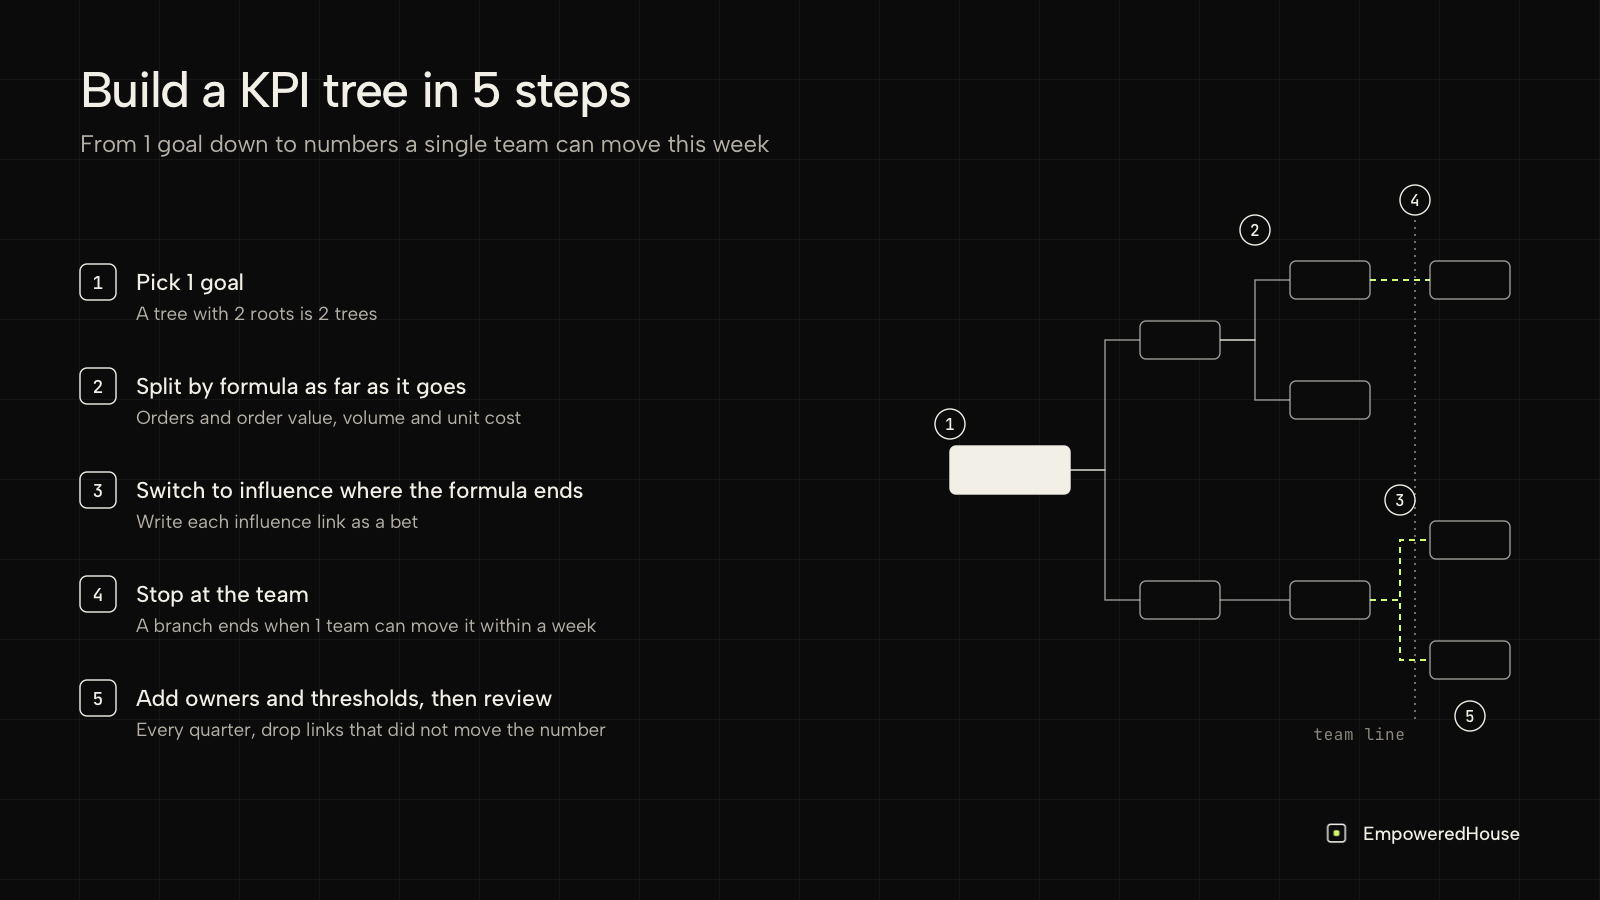
- Pick 1 goal per tree. A tree with 2 roots is 2 trees. A company may need several trees, such as profit, retention and delivery reliability, but each answers 1 management question.
- Split by formula as far as it goes. Revenue into orders and order value, costs into volume and unit cost. Formula branches are exact only when their inputs share definitions, units and periods, so agree on those first: revenue in the CRM is not always revenue in the ledger.
- Switch to influence where the formula ends. Write each influence link as a bet: "if quote requests are answered within 24 hours, orders rise".
- Stop at the team. A branch ends when 1 team can watch the number regularly and act on it. Below that, it is that team's own business.
- Add owners and thresholds, then review. Each number gets 1 accountable role and a threshold agreed in advance. The owner explains changes and coordinates action; they do not control every factor behind the number. Review influence links every quarter, and keep, change or remove each one based on the evidence, the expected delay and the quality of the measurement.
What is the difference between formula links and influence links?
Many KPI trees mix the 2 kinds without saying so, and that is where arguments start. A formula link is true by definition, once the inputs share the same definitions: if orders double at the same order value, revenue doubles. An influence link is a hypothesis: faster quotes should lift orders, but only data will show by how much.
To test an influence link, record the baseline, change 1 practice where you can, and compare the result over a period long enough for the effect to show. Account for changes in customer mix and demand. If 1 quarter shows no effect, investigate before you drop the link; if the evidence stays unclear, keep it marked as a hypothesis.
How do you check a KPI tree before a review?
A KPI tree is only as reliable as its definitions. Before you call a link a formula, check that parent and child use the same period, the same customers, the same currency and the same accounting basis. Ask 5 questions before each management review:
- Do the formula branches add up to the number above?
- Is each cost counted only once?
- Do the numbers below the goal describe the same customers or orders as the goal?
- Is every influence link marked as a hypothesis?
- Does each number have an owner and an agreed next action?
How do you use a KPI tree in a weekly review?
Say operating profit fell last month. Start at the top and follow the formula: did revenue fall, did cost of goods sold rise, or did operating expenses rise? The formula branch tells you which part explains the change. That is an accounting explanation.
Then move to the influence branches under that part to ask why it changed. If fulfilment cost rose, look at single-pass picking and second trips, and ask the warehouse lead what the evidence supports. That is still a hypothesis until the data confirms it. Record the decision, and check its effect at the next review where the change can show.
Where should KPI tree definitions live?
A KPI tree is only as good as the definitions behind it, so they need 1 home. In our own company, that home is a repository of plain text files we call the Company OS (starter kit on GitHub, MIT licence). It holds our terminology, who decides what, and company decisions as numbered files. Live numbers stay in the tools that record them.
The same split could work for a KPI tree: the tree, the definitions and the owners in 1 shared document, the numbers in the ERP, the CRM and the spreadsheets. When 2 teams read the same definition of revenue, the meeting can be about the decision instead of the definition.
When should you not build a KPI tree?
A formal KPI tree across teams adds less when 1 team can already explain and act on the main drivers of a result. It becomes useful when several teams influence the same result and their responsibilities or trade-offs are unclear. And if the leadership team has not agreed on the goal itself, a tree will only make the disagreement look precise. Settle the goal first; Karol Wojtaszek's article on how to keep teams aligned covers that conversation.
Checking an influence link needs data from more than 1 system: quote times in the CRM, orders in the ERP, decisions in someone's notes. Empowered Intelligence is software by Empowered House that reads the tools a company already uses, such as Notion, Airtable and Attio, and shows leaders how the company runs, with sources behind its answers. That way the evidence for each link can be checked record by record.
FAQ
What is a KPI tree?
A KPI tree is a diagram that breaks a company goal into the numbers that explain or influence it, down to metrics a single team can act on. Each link is a formula or an influence, and each number has an accountable owner.
What is an example of a KPI tree?
For a distributor, operating profit splits into revenue, cost of goods sold and operating expenses; revenue splits into orders and average order value; and team metrics such as the share of quote requests answered within 24 hours sit below as influences to test.
What should a KPI tree template include?
At least a metric ID and parent ID, so the rows form a tree, plus the definition, link type, unit and period, data source, owner, review rhythm, threshold and the evidence status of each influence link.
What is the difference between a KPI tree and OKRs?
OKRs set goals and key results for a period, team by team. A KPI tree shows how the numbers connect: which team metric moves which company result. Teams can use the tree to choose key results that contribute to a shared company result.
Is a KPI tree the same as a metric tree or a driver tree?
The names are often used interchangeably. Some frameworks separate goal-focused KPI trees from metric trees that describe how a process performs. The practical method is the same: connect a result to the numbers that explain or influence it.
How many levels should a KPI tree have?
As many as it takes for every bottom number to belong to 1 team that can act on it. In both examples above, that is 3 or 4 levels.
If several teams share a result but nobody can say who influences which part of it, start with 1 branch. Agree on the definitions, name the owner and test the next link. A useful KPI tree is one that helps the next decision, however small it is.