Leading and lagging indicators measure the same work at different times. A lagging indicator records a result after the work is done, such as last month's on-time delivery; a leading indicator moves earlier and a team can change it this week, such as the share of orders released with a complete specification. Operations leaders need both, in pairs: each result next to 1 to 3 measures that move it.
You should not run the weekly operations review on lagging numbers alone. By the time on-time delivery drops, the orders that caused the drop shipped weeks ago, and the meeting can only explain the number.
What is the difference between leading and lagging indicators?
A lagging indicator measures an outcome; a leading indicator measures an activity or condition that comes before the outcome and that the team can influence. The idea is older than the dashboard: in 1992 Robert Kaplan and David Norton argued in Harvard Business Review that financial results report on actions already taken and need operational measures beside them that drive future performance. FranklinCovey's 4 Disciplines of Execution puts it in one line: a lag measure tells you whether you reached the goal, and a lead measure tells you whether you are likely to.
| Lagging indicator | Leading indicator | |
|---|---|---|
| What it measures | A result that already happened | A condition or activity that comes before the result |
| When you see it | After the period closes | During the week, while you can still act |
| Who can change it | Nobody directly; it is the sum of earlier work | The team that owns the activity |
| Example in fulfilment | On-time-in-full deliveries last month | Orders picked by noon the day before dispatch |
| Main risk | You learn about the problem too late | It measures effort that does not move the result |
Economists and safety managers use the same terms for other things: GDP forecasts in one case, near-miss reports in the other. This article is about the indicators an operations leader reviews every week.
30 leading and lagging indicator examples for operations
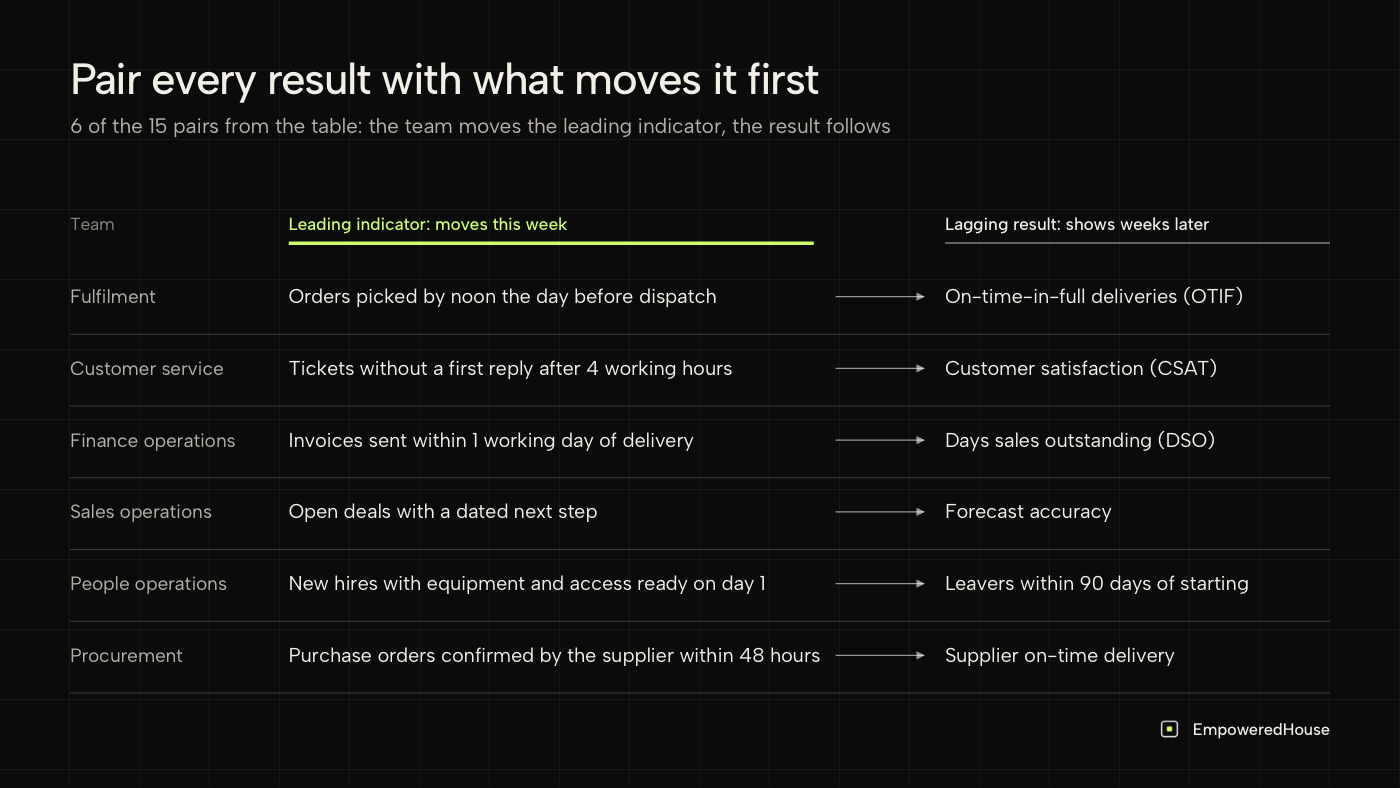
The 15 rows below pair a lagging result with a leading indicator that comes before it, 30 indicators in all, and the action that moves the leading indicator. Treat each pair as a bet to test on your own data, not a proven rule. Copy the table and replace the examples with your own systems and thresholds.
| Team | Lagging result | Leading indicator | What the team can do this week |
|---|---|---|---|
| Fulfilment | On-time-in-full deliveries (OTIF) | Orders picked by noon the day before dispatch | Move picking for next-day orders to the morning shift |
| Fulfilment | Customer returns rate | Orders shipped without a final quality check | Add a check for the 3 products with the most returns |
| Fulfilment | Stock-outs per month | Items below reorder point without an open purchase order | Review the reorder list every Monday |
| Customer service | Customer satisfaction (CSAT) | Tickets without a first reply after 4 working hours | Assign an owner to the queue at the start of each shift |
| Customer service | Repeat contacts within 7 days | Tickets closed without a confirmed fix | Ask for confirmation before closing |
| Finance operations | Days to close the month | Bank and supplier reconciliations finished by day 3 | Reconcile weekly instead of at month end |
| Finance operations | Days sales outstanding (DSO) | Invoices sent within 1 working day of delivery | Trigger the invoice from the delivery record |
| Finance operations | Late supplier payment fees | Supplier invoices waiting for approval for more than 5 days | Send a daily list of waiting approvals to each approver |
| Sales operations | Revenue against plan | Qualified pipeline as a multiple of next quarter's target | Review deals without a next meeting in the calendar |
| Sales operations | Forecast accuracy | Open deals with a dated next step | Ask for a date on every deal moved to the forecast |
| People operations | Leavers within 90 days of starting | New hires with equipment and access ready on day 1 | Start the access request when the offer is signed |
| People operations | Time to hire | Interview feedback recorded within 24 hours | Block 15 minutes after each interview for feedback |
| Projects and delivery | Projects delivered on the date promised | Decisions waiting for more than 5 days | Put open decisions first on the weekly agenda |
| IT and internal systems | Incidents caused by changes | Changes released without a second reviewer | Require a reviewer for changes to shared systems |
| Procurement | Supplier on-time delivery | Purchase orders confirmed by the supplier within 48 hours | Chase every order still unconfirmed after 2 days |
Decisions that stall or get reopened deserve their own row. In a Gartner survey of 151 supply chain leaders at companies with at least $250 million in revenue, 72% said they had to revisit final approvals for supply chain network decisions at least once, contributing to delays.
The rule behind every row: the leading indicator is in a system you already run, it moves fast enough to discuss in the weekly review, and 1 named team owns the response.
How to tell if a leading indicator really leads
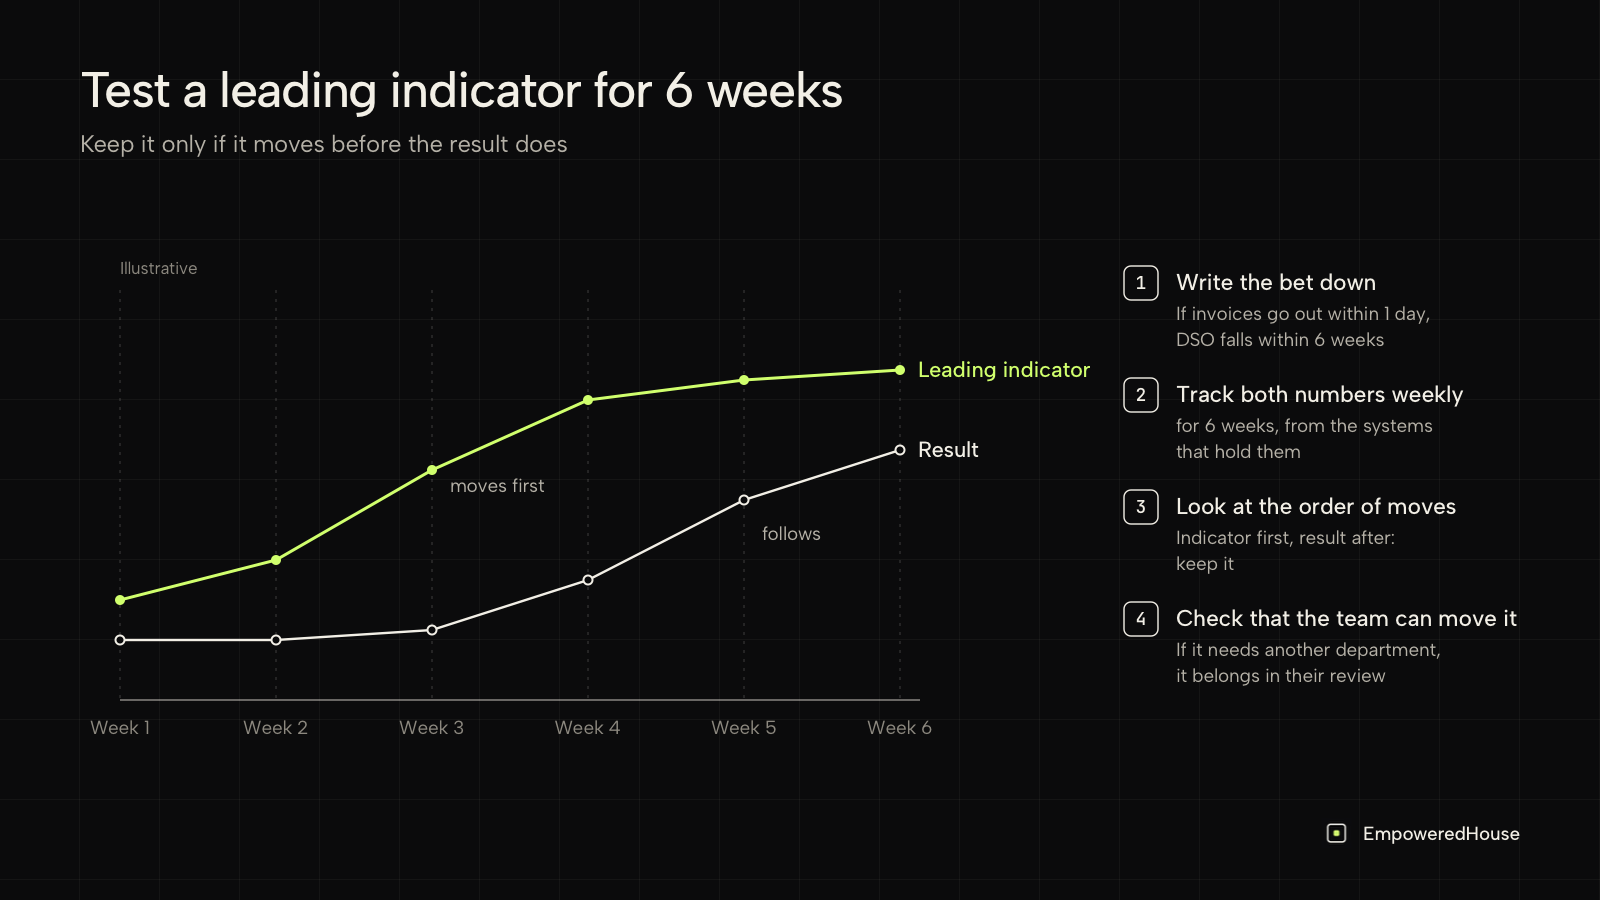
A leading indicator earns its place when changes in it come before changes in the result. Not every candidate does, so test each one before it goes into the weekly review.
- Write the bet down. "If the share of invoices sent within 1 day rises, DSO falls within 6 weeks."
- Track both numbers weekly for 6 weeks as a first pilot, from the systems that hold them, not from memory. Slow results such as hiring or retention need longer.
- Look at the order of moves. If the leading indicator moved first and the result followed, keep it as a candidate. Moving first is not proof: check whether something else changed at the same time, such as a large customer, a season or a new procedure. If the result moved on its own, the indicator measures effort, not cause.
- Check that the team can move it. If the people who own it need another department to act, it belongs to that department's review.
The test also protects against gaming. Once a leading indicator becomes a target, people learn to move the number without moving the work. The anthropologist Marilyn Strathern gave Goodhart's law its best-known wording: "When a measure becomes a target, it ceases to be a good measure" (European Review, 1997).
How many indicators should one team track?
For a weekly review, start with 1 lagging result and up to 3 leading indicators. A team that tracks 12 leading indicators reviews them; a team that tracks 3 acts on them. If a team needs more, the result it owns is too broad, and it should split into 2 results with their own leading indicators.
Common mistakes with leading and lagging indicators
Managers know their indicators need work: in a global survey published by MIT Sloan Management Review and BCG in 2024 with 3,043 respondents, 60% of managers said they believe they need to improve their KPIs. These are the 4 mistakes to fix first.
- Only lagging numbers in the weekly review. The meeting becomes a discussion of the past.
- Leading indicators nobody can change. "Market demand" comes before revenue, but no team moves it this week.
- Counting activity instead of conditions. "Calls made" rises easily; "deals with a dated next step" is harder to fake.
- Indicators typed in by hand. If someone copies the number into a spreadsheet on Friday, it arrives late and changes with the person typing it. A spreadsheet the system fills on its own is fine.
Where the signals already are
Most leading indicators in the table already sit in systems the company runs: the ERP holds picking times, the ticketing system holds first replies, the CRM holds next steps. The work is connecting them to the result they predict and showing them to the person who can act.
At EmpoweredHouse we build Empowered Intelligence for leaders who want to see the company in motion, not only last month's totals. How we map a process before choosing what goes into software is described in our method.
FAQ
What is a leading indicator in business?
A leading indicator is a measure that changes before a business result and that a team can influence, such as qualified pipeline before revenue or invoices sent on time before cash collected.
Is customer satisfaction a leading or lagging indicator?
For the service team it is lagging, because it records how earlier tickets went. For revenue it can lead, because satisfied customers renew. The same number can be both, depending on the result you pair it with.
Is revenue a lagging indicator?
Yes. Revenue records sales that already closed, so a sales team needs leading indicators such as pipeline coverage and deals with a dated next step to act before the quarter ends.
What if a leading indicator improves but the result does not?
Either the lag is longer than you allowed, or the indicator measures effort, not cause. Check the timing first, then check whether people moved the number without changing the work.
What is the difference between a KPI and a leading indicator?
A KPI is any indicator a company decides to manage by. It can be leading or lagging. Lagging KPIs are easier to measure, which is why KPI lists start with them; leading ones are what a team acts on during the week.
If your team reviews 1 number a quarter, keep it lagging. If you review weekly, put a leading indicator next to every result, and replace any that has not led after a fair test.